
Gallup and Sharecare Release 2017 State Well-Being Rankings
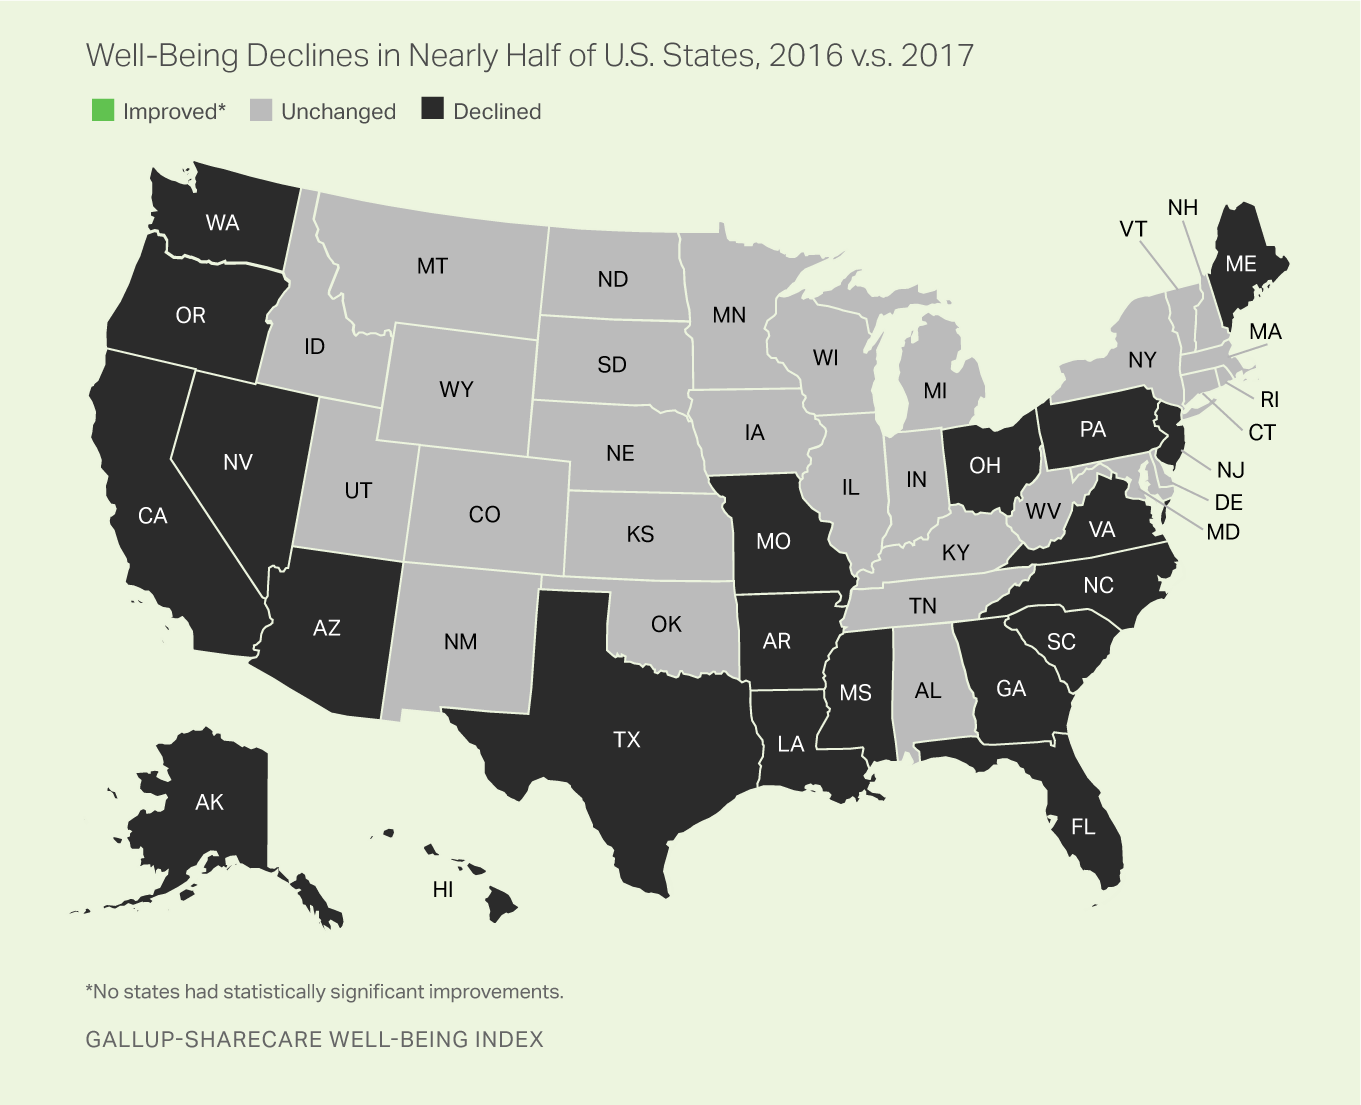
Gallup-Sharecare Well-Being Index shows widespread downturn in well-being across nation; South Dakota, Vermont and Hawaii take top spots for highest well-being in U.S.
WASHINGTON, D.C. & ATLANTA (February 13, 2018) – World-leading analytics and advice firm Gallup, and Sharecare, the digital health company helping people manage all their health in one place, today announced the 2017 annual state rankings from the Gallup-Sharecare Well-Being Index, which measures well-being across the five elements that comprise it: purpose, financial, physical, social and community. In addition to revealing a decline in overall national well-being in 2017, for the first time in nine years of tracking well-being through the Gallup-Sharecare Well-Being Index, a record 21 states experienced declines and zero states improved well-being.
“This year’s findings emphasize the interconnectivity and influence the elements have on each other, which can be seen by the significant impact purpose well-being declines had on scores nationwide,” said Dan Witters, research director for the Gallup-Sharecare Well-Being Index. “Research shows that holistic well-being leads to greater resiliency, adaptability to change and productivity, among other benefits. To capitalize on the advantages, it is imperative for us to promote well-being across every element.”
Despite the national downturn, the Gallup-Sharecare Well-Being Index found improvement in several traditional measures of physical health in 2017, such as the proportion of Americans reporting participation in regular exercise, abstention from smoking and being overweight. Community well-being – defined as liking where you live, feeling safe and having pride in your community – also improved for Americans between 2016 and 2017. Although improvements in certain physical health categories and community well-being signal progress, the sharp declines in overall well-being were driven by drops in purpose and social well-being metrics, as well as the mental health aspects of physical well-being. Out of a possible score of 100, the national Well-Being Index score dropped from 62.1 in 2016 to 61.5 in 2017, marking the largest year-over-year decline since the index began in 2008.
“This past year showed promising improvement in several behaviors associated with healthy living, yet it also serves as a wake-up call to remind us that the inner hallmarks of well-being deserve our attention,” said Ashlin Jones, vice president, research and advanced data science at Sharecare. “As we look toward improving all aspects of well-being, organizations and leaders across the states will be challenged to bridge innovation with evidence-based best practices to create positive change within their respective populations.”
For the individual U.S. state rankings, South Dakota claimed the top spot, with the highest well-being score of 64.1 out of 100 possible points. Vermont followed closely at number two, sharing a rounded score of 64.1 with South Dakota. With a score of 63.4, Hawaii ranked third, making it one of only two states that have ranked in the top 10 every year since Sharecare and Gallup began measuring well-being in 2008. Although purpose and social well-being declines led to lower scores among most U.S. states, high scores in purpose well-being in South Dakota and social well-being in Vermont catapulted these two states into their top positions in 2017. Hawaii also placed among the top four states for purpose, social and community well-being, and is the only state in the country that ranked in the top 10 across all elements of well-being in 2017. South Dakota, Vermont and Hawaii have consistently ranked highly as “well-being elite” states since the inception of the Gallup-Sharecare Well-Being Index.
National Well-Being Scores by Element
| 2016 | 2017 | Change | |
| Overall Well-Being | 62.1 | 61.5 | -0.6 |
| Physical Well-Being Score | 61.1 | 60.5 | -0.6 |
| Community Well-Being Score | 61.9 | 62.0 | 0.1 |
| Financial Well-Being Score | 61.5 | 61.1 | -0.4 |
| Social Well-Being Score | 61.5 | 59.9 | -1.6 |
| Purpose Well-Being Score | 61.1 | 59.7 | -1.4 |
Highest and Lowest Well-Being Scores in U.S. States
| 1 | South Dakota | 41 | Rhode Island |
| 2 | Vermont | 42 | Indiana |
| 3 | Hawaii | 43 | Nevada |
| 4 | Minnesota | 44 | Ohio |
| 5 | North Dakota | 45 | Kentucky |
| 6 | Colorado | 46 | Oklahoma |
| 7 | New Hampshire | 47 | Mississippi |
| 8 | Idaho | 48 | Arkansas |
| 9 | Utah | 49 | Louisiana |
| 10 | Montana | 50 | West Virginia |
The Well-Being Index is calculated on a scale of 0 to 100, where 0 represents the lowest possible well-being and 100 represents the highest possible well-being.
For more information about the Gallup-Sharecare Well-Being Index 2017 state rankings, download the complete report Gallup-Sharecare State of American Well-Being_2017-State-Rankings
Large Cities Top Small Towns, Rural Areas in Well-Being
- Large communities have much better physical health than small towns
- Communities of all sizes have suffered similar well-being declines in 2017
- General life ratings improving for those in small towns and rural areas
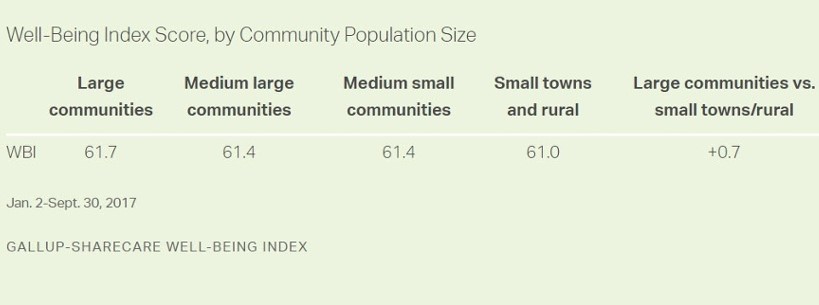
WASHINGTON, D.C. — Residents of highly populated communities have better overall well-being than their counterparts in less populated areas, based on their overall scores on the Gallup-Sharecare Well-Being Index. Overall, large communities have a Well-Being Index score of 61.7 so far in 2017, compared with 61.4 for midsized communities and 61.0 for small towns and rural areas.
These data are drawn from more than 121,000 interviews with U.S. adults across all 50 states from Jan. 2-Sept. 30, 2017. The large sample size means that even small differences in Well-Being Index scores are statistically significant.
The four reporting groups in this article are based on the following definitions:
- Large communities: metropolitan areas with populations of at least 1 million
- Medium large communities: metropolitan areas with populations ranging from 250,000 to less than 1 million
- Medium small communities: metropolitan and “micropolitan” areas with populations ranging from 13,000 to less than 250,000
- Small towns and rural: towns of under 13,000 and those residing in rural areas
The Gallup-Sharecare Well-Being Index is calculated on a scale of 0 to 100, where 0 represents the lowest possible well-being and 100 represents the highest possible well-being. The Well-Being Index score is made up of metrics drawn from each of the five essential elements of well-being:
- Purpose: liking what you do each day and being motivated to achieve your goals
- Social: having supportive relationships and love in your life
- Financial: managing your economic life to reduce stress and increase security
- Community: liking where you live, feeling safe and having pride in your community
- Physical: having good health and enough energy to get things done daily

Small Towns and Rural Areas Lag Behind in Physical Well-Being
The main reason residents of larger communities have higher well-being is because they have much better physical health, with a score of 61.3 vs. 58.7 in small towns and rural areas. However, residents of smaller communities do have advantages on other key elements of well-being. For example, medium small communities have better purpose and financial well-being than the other three groups, while those who live in small towns and rural areas easily have the best community well-being.
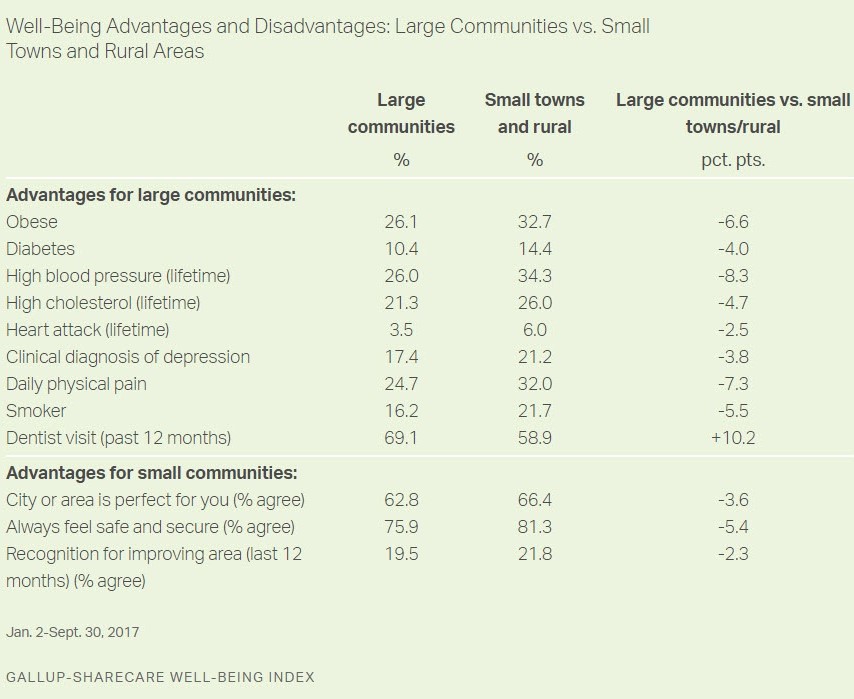
Residents of large communities have higher physical well-being, primarily because of lower rates of obesity and other chronic diseases. They also are more likely to engage in healthy behaviors such as visiting the dentist and not smoking.
On the other hand, residents of small towns and rural areas are more likely to report that they always feel safe and secure, to feel their area is “perfect” for them and to be recognized for volunteering in a way that improves the areas where they live.
Communities of All Sizes Experience Well-Being Declines in 2017
While large and small communities have different well-being advantages, communities of all population sizes have experienced declines in well-being of roughly equal size this year. Together, these declines contribute to a drop in well-being for the nation as a whole this year compared with 2016. Before 2017, well-being in the U.S. had risen for two consecutive years.
Life Evaluation Edging Up in Small Towns/Rural Areas
Despite the overall decline in well-being, there is a bright spot for those living in medium small communities, small towns and rural areas: a meaningful increase this year in how they evaluate their lives. This measure, known as life evaluation, is a general rating of one’s life today and in the future. People who rate both their current and their future lives highly on the steps of an imaginary ladder, based on the Cantril Self-Anchoring Striving Scale, are considered “thriving.”
The same upward trend in life evaluation has not occurred for those who live in larger communities. Still, as is the case with well-being generally, life evaluation tends to be higher in more populated areas than in less populated areas.

Implications
Well-being is higher for people living in more populated areas than for those living in sparsely populated areas, but communities of different population sizes have different well-being advantages and disadvantages.
Notably, community well-being — liking where you live, feeling safe and having pride in your community — is decidedly better as population size declines. Large communities, in turn, have residents with better physical well-being, possibly attributable to cultural norms and more readily available built infrastructure such as parks, bike paths and fitness centers for enhancing physical health. Those in small towns and rural areas simply have fewer visible healthy lifestyles to emulate and are arguably less culturally incentivized to pursue them.
The decline of well-being generally across all sizes of communities mirrors what is found nationally, but life evaluation more specifically serves as an exception for residents of more sparsely populated areas of the country. The reasons for the uptick in life evaluation within these areas are uncertain, but one possible explanation is that it reflects a more positive reaction to Republican President Donald Trump occupying the White House. Trump’s vote share was significantly higher in medium to small communities and rural areas, and prior research has shown that life evaluation among certain political and demographic groups can change dramatically when control of the White House transitions from one party to the other.
Results are based on 121,396 telephone interviews with U.S. adults across all 50 states and the District of Columbia, conducted from Jan. 2-Sept. 30, 2017. In 2016, a total of 176,702 interviews were conducted from Jan. 2-Dec. 30. Gallup conducts 500 telephone interviews daily, resulting in a sample that projects to an estimated 95% of all U.S. adults.
The Well-Being Index margin of sampling error for the reported groups is about ±0.3 points. All reported margins of sampling error include computed design effects due to weighting.
Each daily sample of national adults for data collected in 2016 comprises 60% cellphone respondents and 40% landline respondents. Daily samples in 2017 comprise 70% cellphone respondents and 30% landline respondents. Additional minimum quotas by time zone and within region are included in the sampling approach.
About the Gallup-Sharecare Well-Being Index™
The Gallup-Sharecare Well-Being Index is an ongoing measurement of well-being, with more than 2.5 million surveys fielded to date. The partnership between Gallup and Sharecare merges decades of clinical research, health care leadership and behavioral economics expertise to track and understand the key factors that drive greater well-being for individuals and populations. Gallup and Sharecare aim to create a healthier world through knowledge, information and action informed by the data and insights gathered.
The Well-Being Index is calculated on a scale of 0 to 100, where 0 represents the lowest possible well-being and 100 represents the highest possible well-being. Through ongoing nationally representative surveys, the Well-Being Index creates a composite picture of health and well-being within the U.S. To learn more, visit www.well-beingindex.com.
About Gallup
Gallup delivers analytics and advice to help leaders and organizations solve their most pressing problems. Combining more than 80 years of experience with its global reach, Gallup knows more about the attitudes and behaviors of employees, customers, students and citizens than any other organization in the world.
About Sharecare
Sharecare is the digital health company that helps people manage all their health in one place. The Sharecare platform provides each person – no matter where they are in their health journey – with a comprehensive and personalized health profile where they can dynamically and easily connect to the information, evidence-based programs and health professionals they need to live their healthiest, happiest and most productive life. In addition to providing individual consumers with direct access to award-winning and innovative frictionless technologies, scientifically validated clinical protocols and best-in-class coaching tools, Sharecare also helps providers, employers and health plans effectively scale outcomes-based health and wellness solutions across their entire populations. To learn more, visit www.sharecare.com