
SNAP moved 3.1 million people out of poverty in 2018
The Supplemental Nutrition Assistance Program (SNAP) reduced poverty by just over 1 percentage point for the three-year period from 2016 to 2018, according to data released by the U.S. Census Bureau.
The Supplemental Poverty Measure (SPM) shows that SNAP – formerly known as food stamps – cut the poverty rate from 14.3% to 13.2%. This means that with SNAP benefits, an average 3.5 million fewer people were living below the poverty line during that three-year period.
However, there are notable state-level variations; New Mexico, Louisiana and Mississippi were among the states where SNAP had the greatest anti-poverty impact (see Table 1 and Figure 1).
Why SPM is Important
The SPM allows us to gauge the potential magnitude of the effect of tax credits and transfers in alleviating poverty.
The SPM, an alternative to the official poverty measure, considers the value of noncash government transfers, taxes, and necessary expenses into the resources a family has available to meet their basic needs.
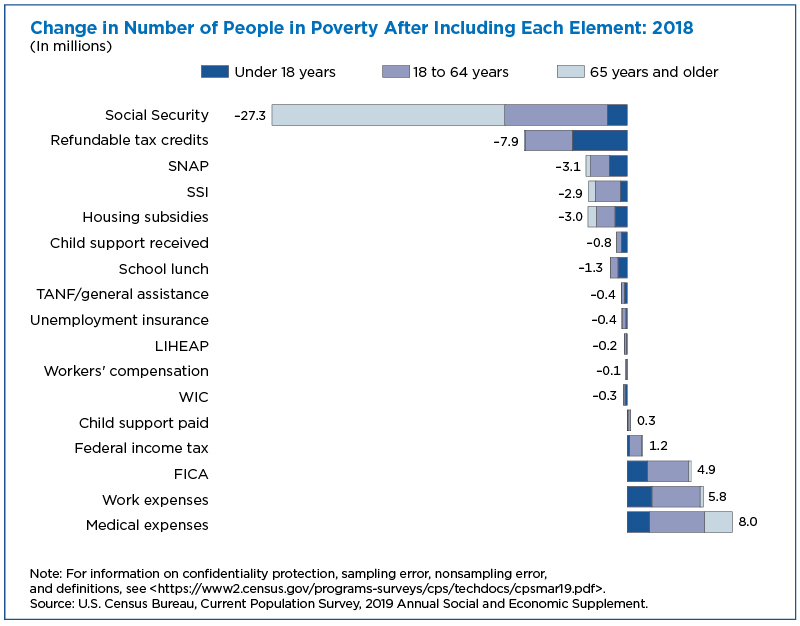
Figure 8 in the The Supplemental Poverty Measure 2018 released today shows how each element, including SNAP, impacts the estimated number of people below the supplemental poverty threshold.

By subtracting the value of SNAP from resources and recalculating poverty rates (assuming no behavioral changes and all else constant), we can show how many people would have been in poverty in the absence of SNAP.
How does SNAP Reduce Poverty across the Country?
SNAP is a nutritional assistance program that aims to help low-income families afford a nutritionally balanced diet. Among the additions to resources considered by the SPM, SNAP has consistently been among the most impactful noncash transfer.
SNAP is estimated to have prevented approximately 3.1 million people from falling into poverty in 2018 and an average of 3.5 million across 2016-2018.
To create state-level estimates using the Current Population Survey Annual Social and Economic Supplement (CPS ASEC), the Census Bureau recommends using 3-year averages for additional statistical reliability.
The 3-year average poverty rate for the United States in 2016-2018 was 13.2% using the SPM. Subtracting out the value of SNAP allows us to estimate that SNAP benefits decreased the SPM rate by slightly above 1 percentage point, from 14.3% to 13.2%.
This means that with SNAP benefits, 3.5 million fewer people were living below the poverty line.
State-by-State Impact
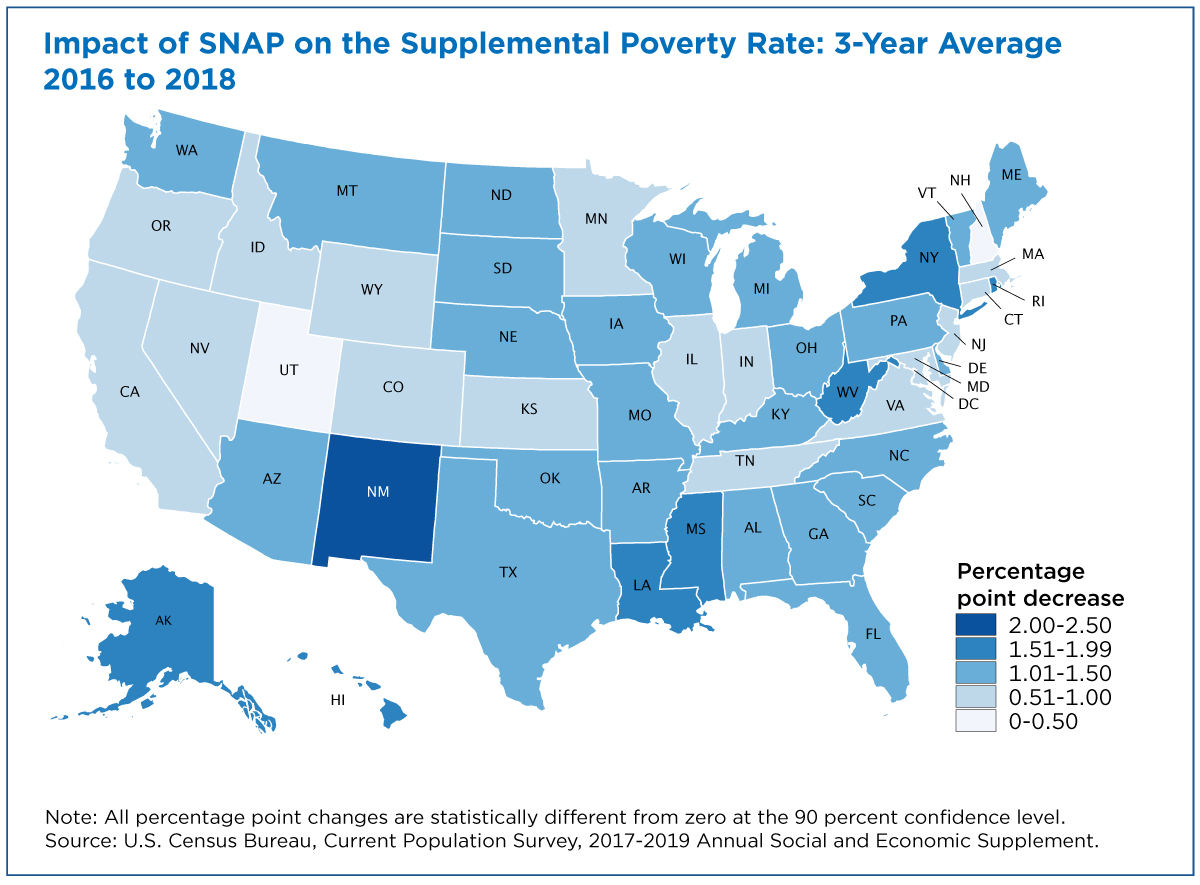
SNAP is estimated to have decreased the SPM rate in 42 of the 50 states and in the District of Columbia by a value that is greater than or not significantly different than 1 percentage point.
Figure 1 above illustrates the impact of SNAP benefits on SPM poverty by state.
New Mexico, Louisiana and Mississippi were among the states where SNAP had the greatest anti-poverty impact, decreasing each state’s SPM rate by 2.3, 1.9 and 1.8 percentage points, respectively.
Impact on Child Poverty
Children under age 18 are the largest age group receiving SNAP. The program is estimated to have decreased the SPM rate for children by 2.0 percentage points on average, from 16.5% to 14.5%.
Again, New Mexico, Louisiana and Mississippi were among the states most affected by SNAP. The program decreased the child poverty rate of each state by 4.5, 3.8 and 3.4 percentage points, respectively.
The map below illustrates the percentage point decrease in the SPM rate among children within each state.

SNAP had less of an impact on the national SPM rate of adults between the ages of 18 and 64 and those 65 years or older.
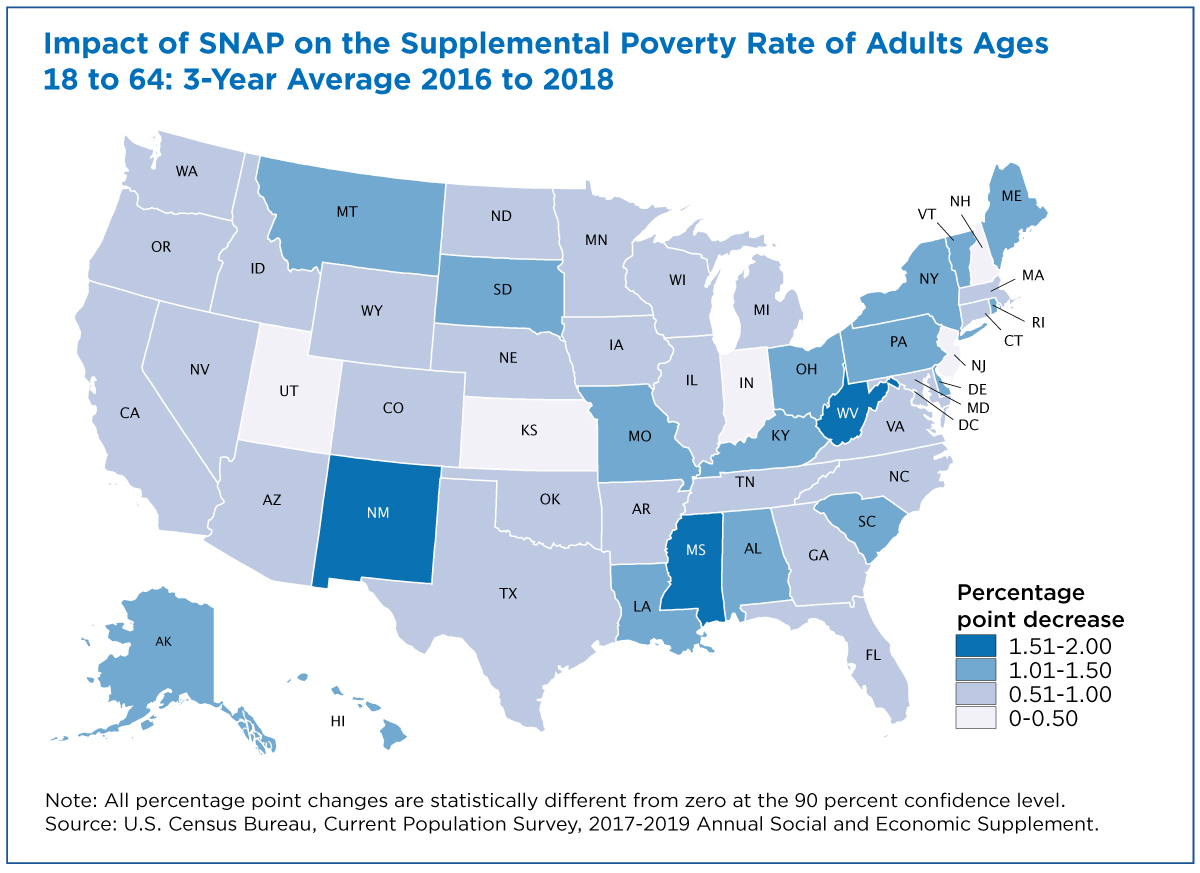
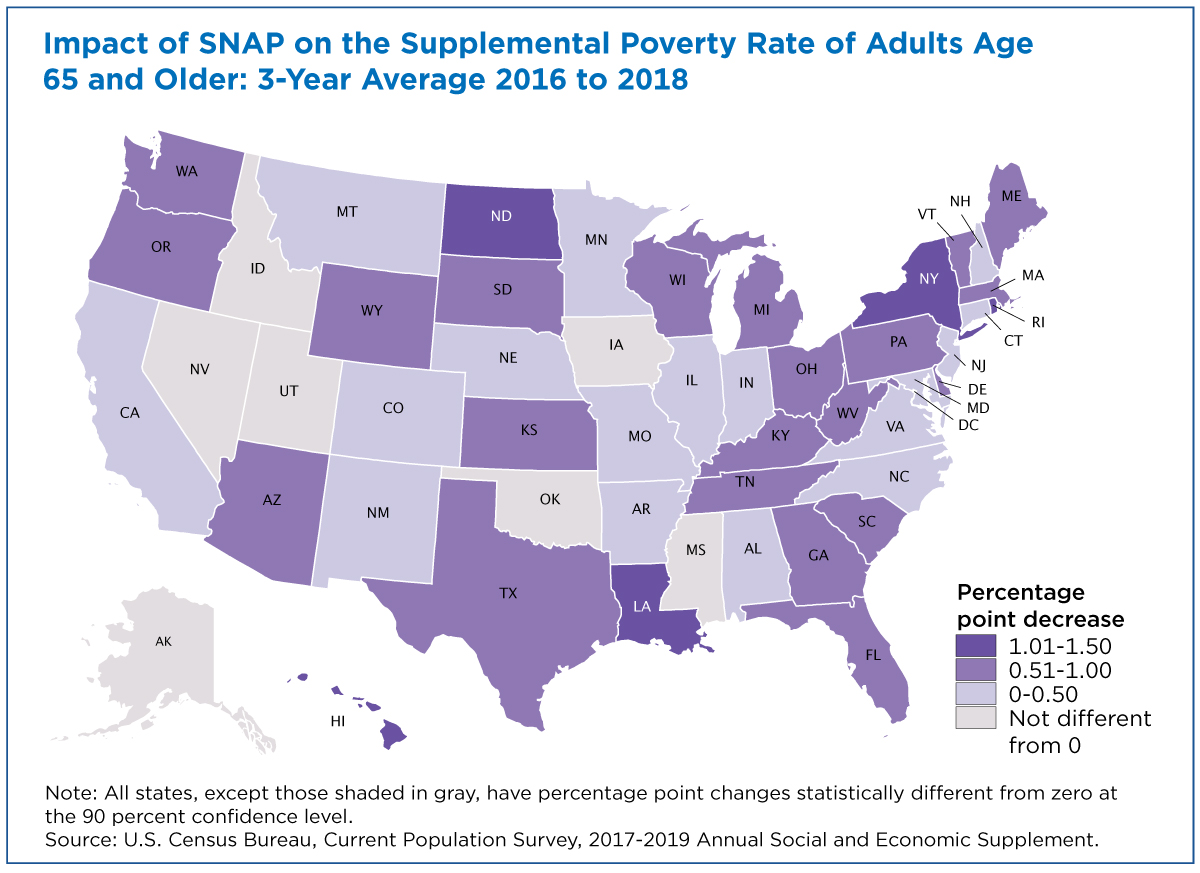
For the United States, SNAP reduced SPM poverty for adults 18 to 64 years by 0.8 percentage points (from 13.5% to 12.7%) and by 0.6 percentage points (from 14.2 to 13.6) for adults aged 65 and over.
See Table 1 below for a list of the 10 states whose populations were most affected by SNAP.

The Supplemental Poverty Measure 2018
Since the publication of the first official U.S. poverty estimates, researchers and policymakers have continued to discuss the best approach to measure income and poverty in the United States. Beginning in 2011, the Census Bureau began publishing the Supplemental Poverty Measure (SPM), which extends the official poverty measure by taking account of many of the government programs designed to assist low-income families and individuals that are not included in the official poverty measure. This is the ninth report describing the SPM, released by the U.S. Census Bureau, with support from the Bureau of Labor Statistics (BLS). This report presents updated estimates of the prevalence of poverty in the United States using the official measure and the SPM based on information collected in 2019 and earlier Current Population Survey Annual Social and Economic Supplements (CPS ASEC).
Highlights
- In 2018, the overall SPM rate was 13.1 percent. This is not statistically different from the 2017 SPM rate of 13.0 (Figure 1).
- SPM rates were not statistically different for any of the major age categories in 2018 compared with 2017. SPM rates for children under the age of 18 were 14.5 percent, which is not significantly different than 14.2 percent in 2017 (Figure 1 and Figure 2).
- The SPM rate for 2018 was 1.3 percentage points higher than the official poverty rate of 11.8 percent (Figure 3).
- There were 16 states plus the District of Columbia for which SPM rates were higher than official poverty rates, 22 states with lower rates, and 12 states for which the differences were not statistically significant (Figure 7).
- Social Security continued to be the most important anti-poverty program, moving 27.3 million individuals out of poverty. Refundable tax credits moved 7.9 million people out of poverty (Figure 8).
Source:The Supplemental Poverty Measure: 2018, US Census Bureau